Accessing Reliable Real-Time Space Weather Data
Space weather affects our modern infrastructure in unseen ways. Learn how to track solar activity, monitor geomagnetic storms, and find reliable data sources.
Accessing Reliable Real-Time Space Weather Data
Space weather is the set of conditions on the Sun and in the solar wind that can influence the performance and reliability of space-borne and ground-based technological systems. While the weather on Earth concerns rain and wind, space weather describes the flow of charged particles and magnetic fields emanating from our star. Understanding these phenomena is essential for anyone interested in modern telecommunications or satellite operations.
Our reliance on technology has made us vulnerable to solar disturbances. Accessing consistent data allows observers to prepare for interference or simply enjoy the spectacle of natural light displays. Establishing a source for this information requires knowing which institutions track the Sun, and how to interpret the technical indices provided by global agencies.
The Science Behind It
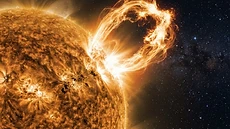
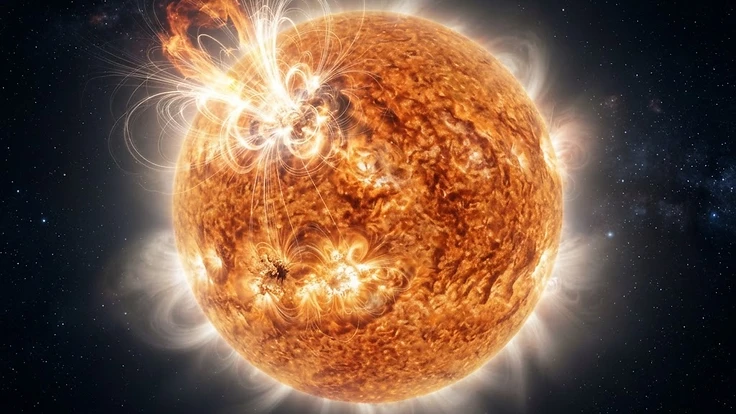
The Sun operates on a cycle of approximately 11 years, during which its magnetic activity waxes and wanes. Solar Cycle 25, which began in December 2019, dictates how frequently we experience events like solar flares or coronal mass ejections. These eruptions release vast amounts of energy into the solar system, often reaching Earth within one to three days.
Live Solar Flare Monitor
Powered by Flarient — embed this on your site →
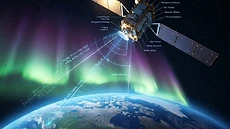
When a coronal mass ejection reaches our planet, it interacts with the geomagnetic field. The strength of this interaction is often categorised by the Kp index, a global measure of magnetic activity on a scale of 0 to 9. Higher values indicate more intense geomagnetic storms, which can create the aurora in regions far from the poles.
Solar particles travel at various velocities, typically ranging from 400 to 700 kilometres per second, though major ejections can reach 3,000 kilometres per second. Because light travels at roughly 300,000 kilometres per second, we see these flares almost immediately, yet the actual plasma cloud takes much longer to arrive. This time gap is our primary window for monitoring and preparation.
Real-World Implications
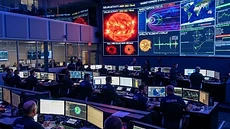
Geomagnetic disturbances can disrupt high-frequency radio communications and impact satellite operations in low Earth orbit. The International Space Station, for instance, orbits at an altitude of approximately 408 kilometres, placing it directly within the reach of these solar particles. Operators must monitor incoming flux to protect sensitive onboard electronics.
Ground infrastructure, such as power grids, faces risks during severe events. A strong storm can induce currents in long-distance electrical transmission lines, potentially overwhelming local infrastructure. Understanding the science behind these events is a prerequisite for long-term planning.
For those curious about historical context, studying the archive of past events helps in understanding the severity of historic storms. The Carrington Event of 1859 remains the benchmark for extreme solar activity. Today, we measure geomagnetic intensity using the Dst index, where values like -100 nT signal significant activity.
What You Can Do
Reliable data is readily available through organisations such as the NOAA SWPC and ESA Space Weather.
These agencies provide raw measurements and imagery that allow enthusiasts to monitor the Sun.
If you prefer a streamlined experience, Flarient offers a live dashboard that aggregates these inputs into a user-friendly format, allowing you to track activity without needing a background in solar physics.
For those seeking to witness the light shows generated by solar storms, [guided aurora tours](https://vi.me/HuXHi) in countries like Iceland, Norway, Canada, and Sweden provide expert logistics for viewing the auroral oval. If you manage your own website, you can use embeddable widgets to display current solar data directly to your audience.
This helps maintain awareness of solar conditions without requiring deep research.
Key Takeaways
Space weather is a constant, dynamic force that influences our technological society. By familiarising yourself with the glossary of terms like G-scales and flare classifications, you can better anticipate periods of increased solar activity. Reliability in data comes from trusting official space agencies and using tools that present this data transparently.
Whether you are an amateur astronomer or a professional in satellite operations, monitoring the Sun is a productive practice. The solar imagery provided by spacecraft such as the Solar Dynamics Observatory offers a clear window into our star. Keep an eye on the long-term trends, and you will find yourself well-prepared for whatever the Sun decides to send our way.
People Also Ask
What is the Kp index and how is it used?+
The Kp index is a global geomagnetic activity index ranging from 0 to 9. It measures the level of disturbance in the Earth's magnetic field caused by solar wind. A Kp of 0 indicates very quiet conditions, while a Kp of 9 signifies an extreme geomagnetic storm.
How do solar flares affect satellites?+
Solar flares emit intense electromagnetic radiation that can ionise the upper atmosphere. This expansion increases atmospheric drag on satellites in low Earth orbit, potentially causing them to deviate from their orbits. Furthermore, high-energy particles can cause electronic upsets or damage sensitive internal hardware.
What happens during a G5 solar storm?+
A G5 event is classified as an extreme geomagnetic storm. It can cause widespread power grid voltage control problems and complete blackout of high-frequency radio communications for hours. Satellite navigation may experience significant degradation, and auroras can be visible in areas much closer to the equator.
Continue Reading
Forecast These Questions
View all →Express your probability on these active forecast questions.